Get Certified for Financial Modeling (FMVA)®
Gain in-demand industry knowledge and hands-on practice that will help you stand out from the competition and become a world-class financial analyst.
Using financial data to assess a company’s performance and make recommendations for the future
Financial analysis involves using financial data to assess a company’s performance and make recommendations about how it can improve going forward. Financial analysts primarily carry out their work in Excel, using spreadsheets to analyze historical data and make projections of how they think the company will perform in the future.
This guide will cover the most common types of financial analysis performed by professionals. Learn more in CFI’s Financial Analysis Fundamentals Course.

The most common examples of financial analysis are:
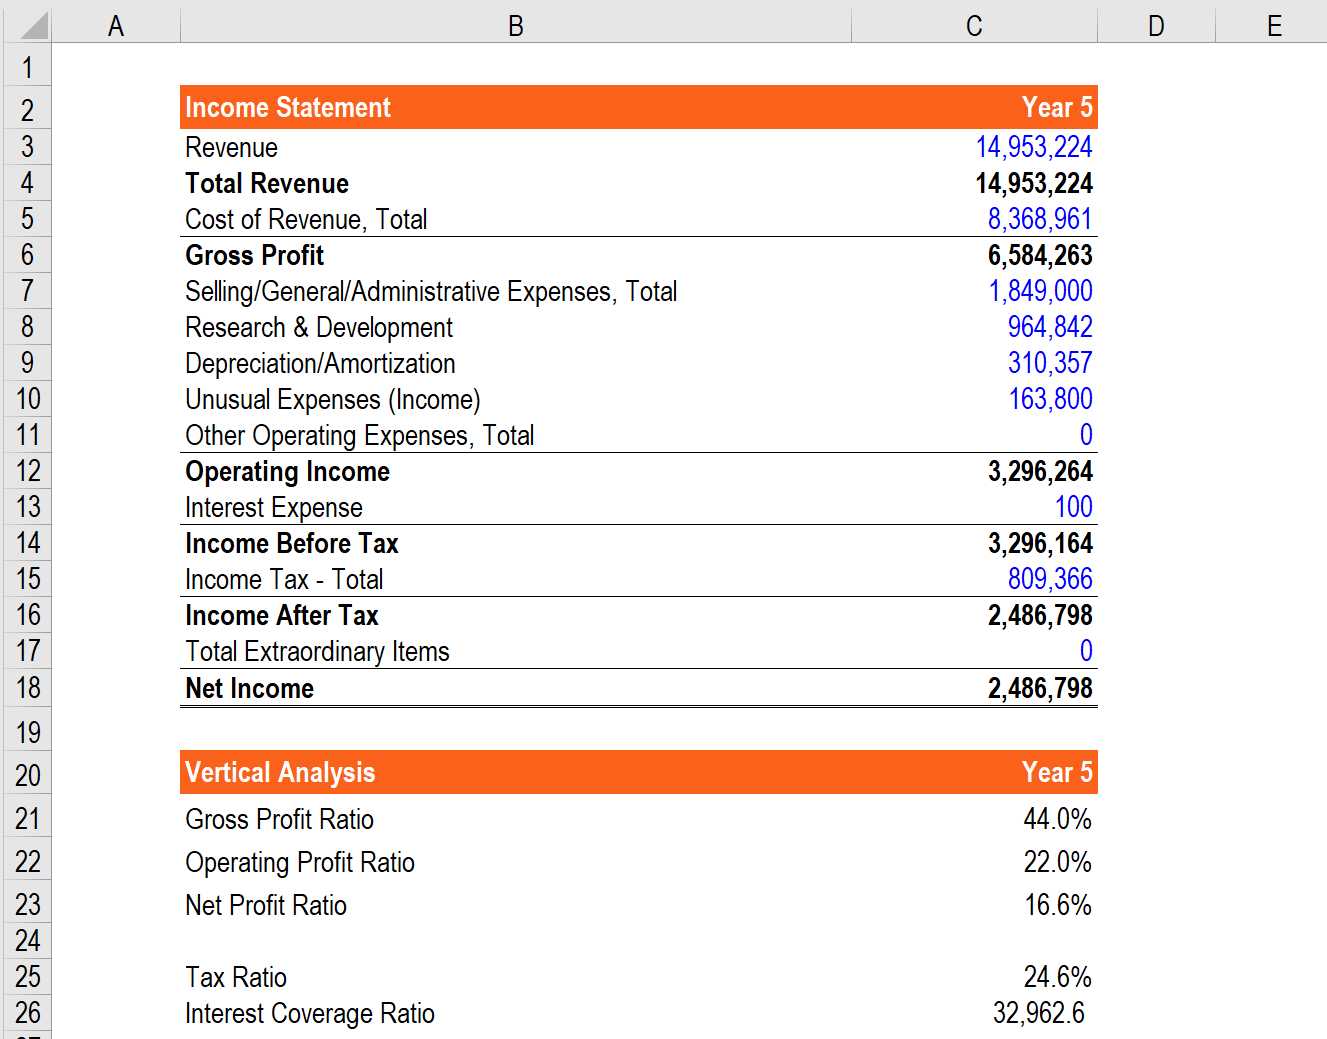
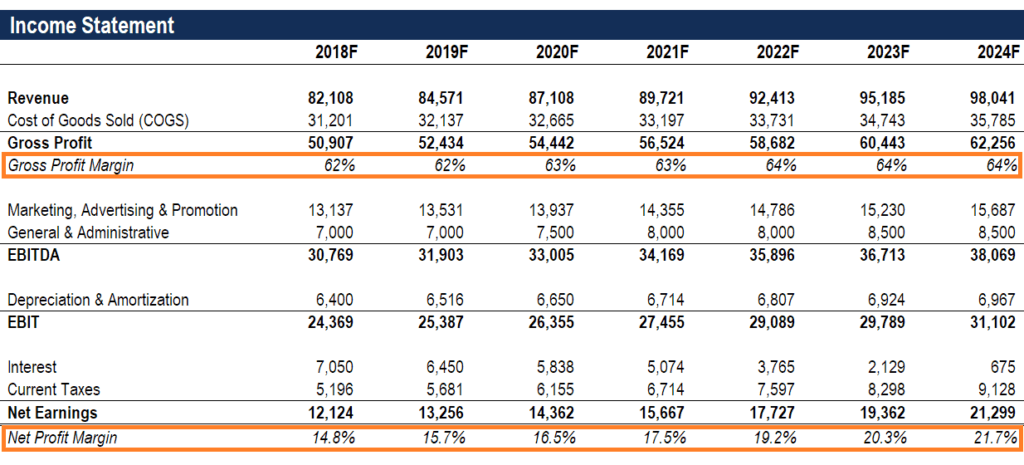
This type of analysis in finance involves looking at various components of the income statement and dividing them by revenue to express them as a percentage. For this exercise to be most effective, the results should be benchmarked against other companies in the same industry to see how well the company is performing.
This process is also sometimes called a common-sized income statement, as it allows an analyst to compare companies of different sizes by evaluating their margins instead of their dollars.
Horizontal analysis involves taking several years of financial data and comparing them to each other to determine a growth rate. This will help an analyst determine if a company is growing or declining, and identify important trends.
When building financial models, there will typically be at least three years of historical financial information and five years of forecasted information. This provides 8+ years of data to perform a meaningful trend analysis, which can be benchmarked against other companies in the same industry.
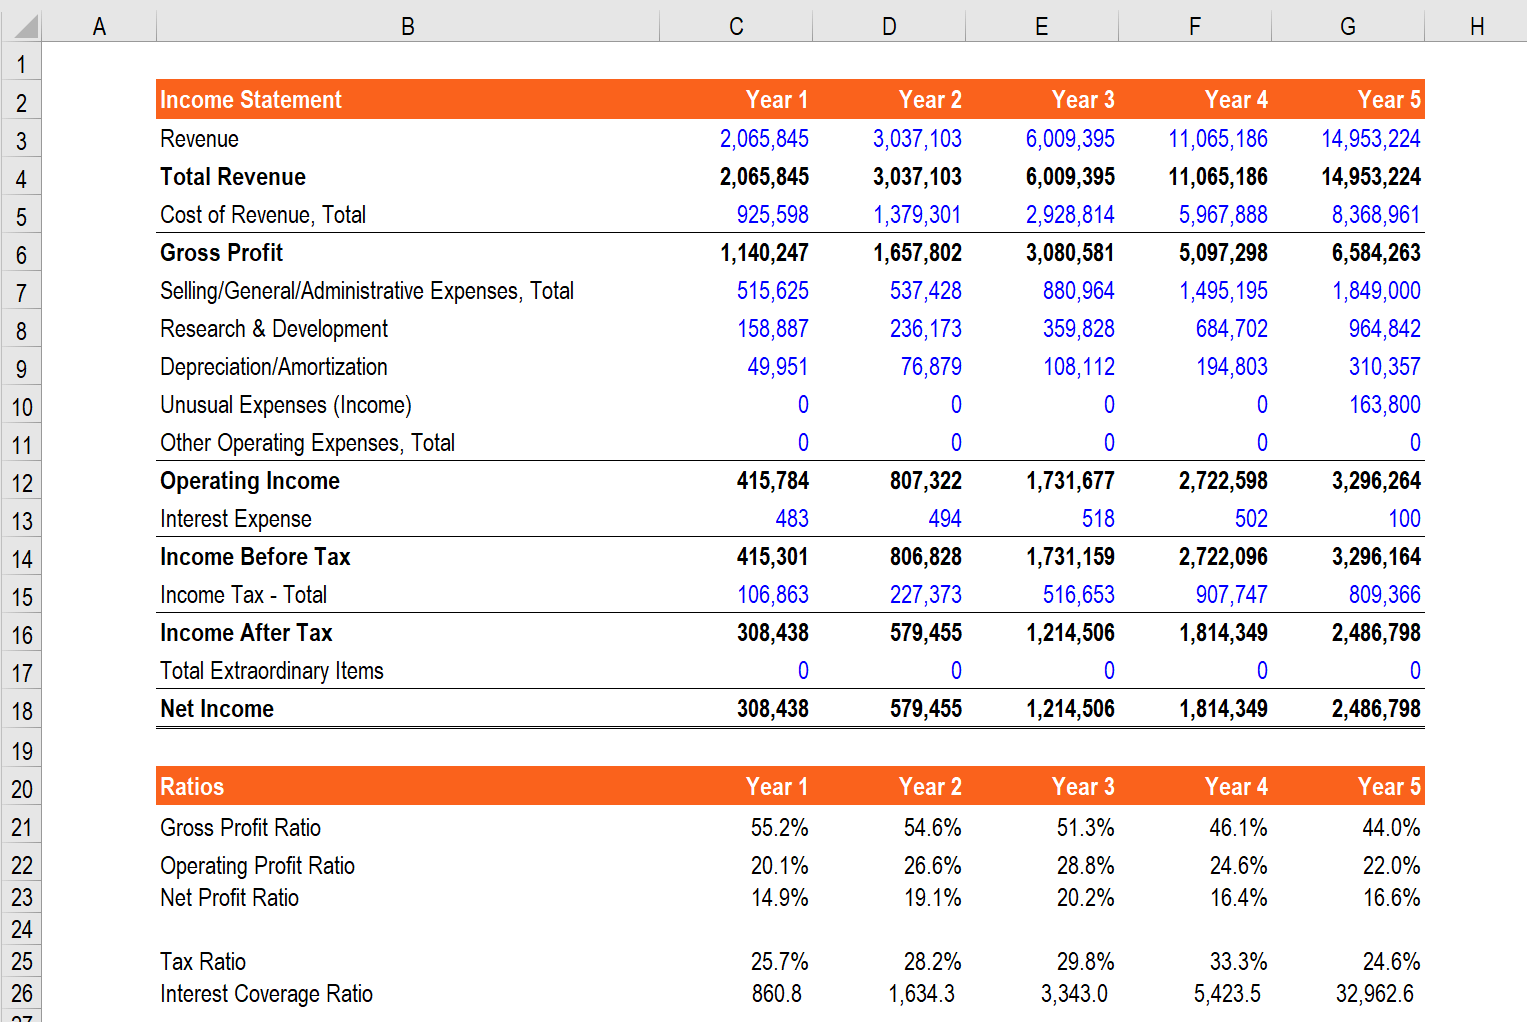
Image: CFI’s Financial Analysis Course.
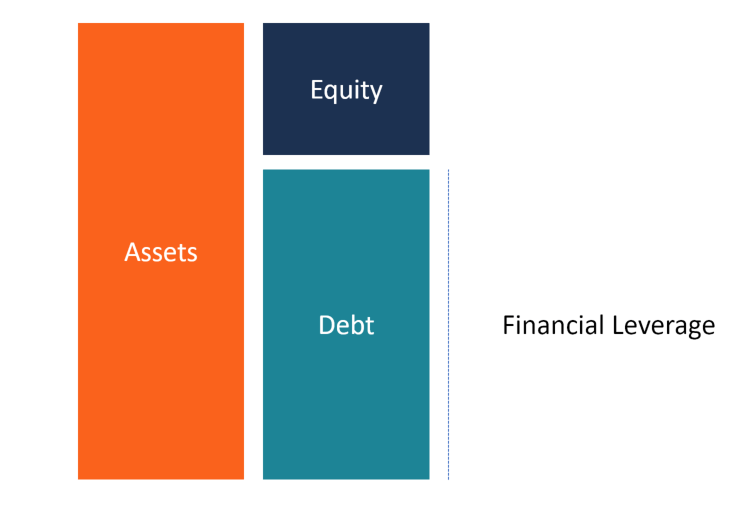
Leverage ratios are one of the most common methods analysts use to evaluate company performance. A single financial metric, like total debt, may not be that insightful on its own, so it’s helpful to compare it to a company’s total equity to get a full picture of the capital structure. The result is the debt/equity ratio.
Common examples of ratios include:
Analyzing historical growth rates and projecting future ones are a big part of any financial analyst’s job. Common examples of analyzing growth include:
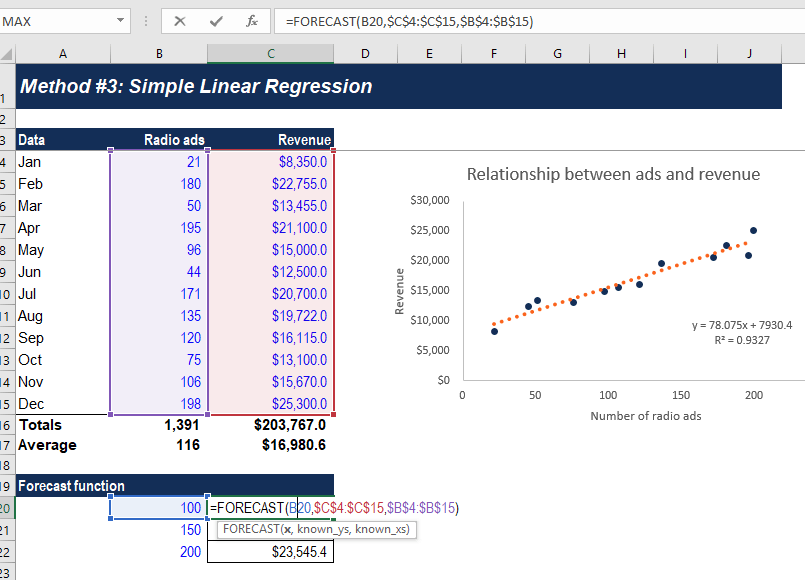
Image: CFI’s Budgeting and Forecasting Course.
Profitability is a type of income statement analysis where an analyst assesses how attractive the economics of a business are. Common examples of profitability measures include:
Learn more in CFI’s Financial Analysis Fundamentals Course.
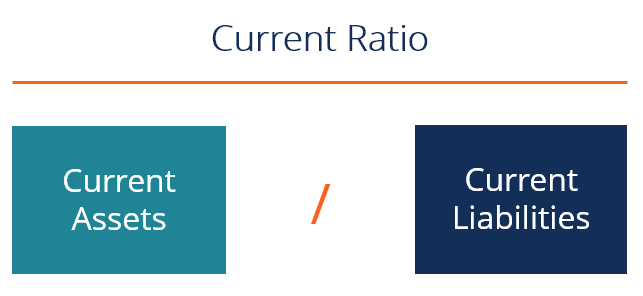
This is a type of financial analysis that focuses on the balance sheet, particularly, a company’s ability to meet short-term obligations (those due in less than a year). Common examples of liquidity analysis include:
Efficiency ratios are an essential part of any robust financial analysis. These ratios look at how well a company manages its assets and uses them to generate revenue and cash flow.
Common efficiency ratios include:

As they say in finance, cash is king, and, thus, a big emphasis is placed on a company’s ability to generate cash flow. Analysts across a wide range of finance careers spend a great deal of time looking at companies’ cash flow profiles.
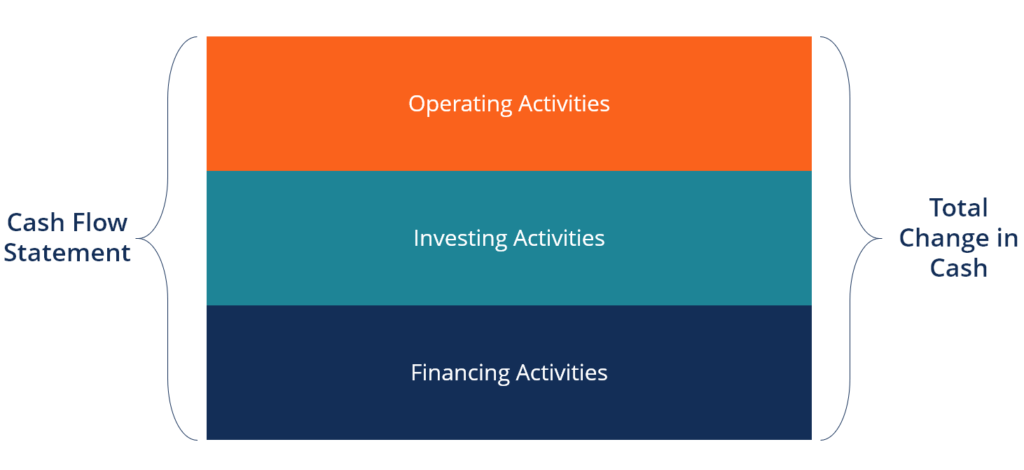
The Statement of Cash Flows is a great place to get started, including looking at each of the three main sections: operating activities, investing activities, and financing activities.
Common examples of cash flow analysis include:
Learn more in CFI’s Financial Analysis Fundamentals Course.
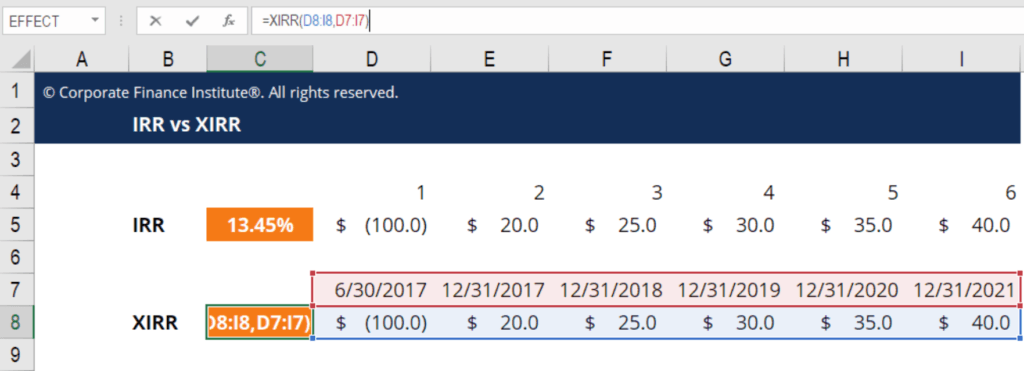
At the end of the day, investors, lenders, and finance professionals, in general, are focused on what type of risk-adjusted rate of return they can earn on their money. As such, assessing rates of return on investment (ROI) is critical in the industry.
Common examples of rates of return measures include:
The process of estimating what a business is worth is a major component of financial analysis, and professionals in the industry spend a great deal of time building financial models in Excel. The value of a business can be assessed in many different ways, and analysts need to use a combination of methods to arrive at a reasonable estimation.
Approaches to valuation include:
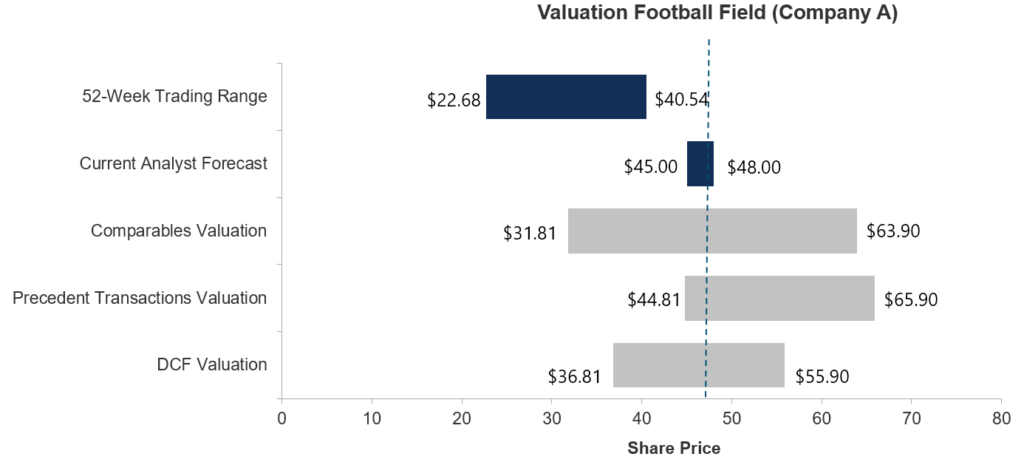
Learn more in CFI’s Valuation Modeling Course.
Another component of financial modeling and valuation is performing scenario and sensitivity analysis as a way of measuring risk. Since the task of building a model to value a company is an attempt to predict the future, it is inherently very uncertain.
Building scenarios and performing sensitivity analysis can help determine what the worst-case or best-case future for a company could look like. Managers of businesses working in financial planning and analysis (FP&A) will often prepare these scenarios to help a company prepare its budgets and forecasts.
Investment analysts will look at how sensitive the value of a company is as changes in assumptions flow through the model using Goal Seek and Data Tables.
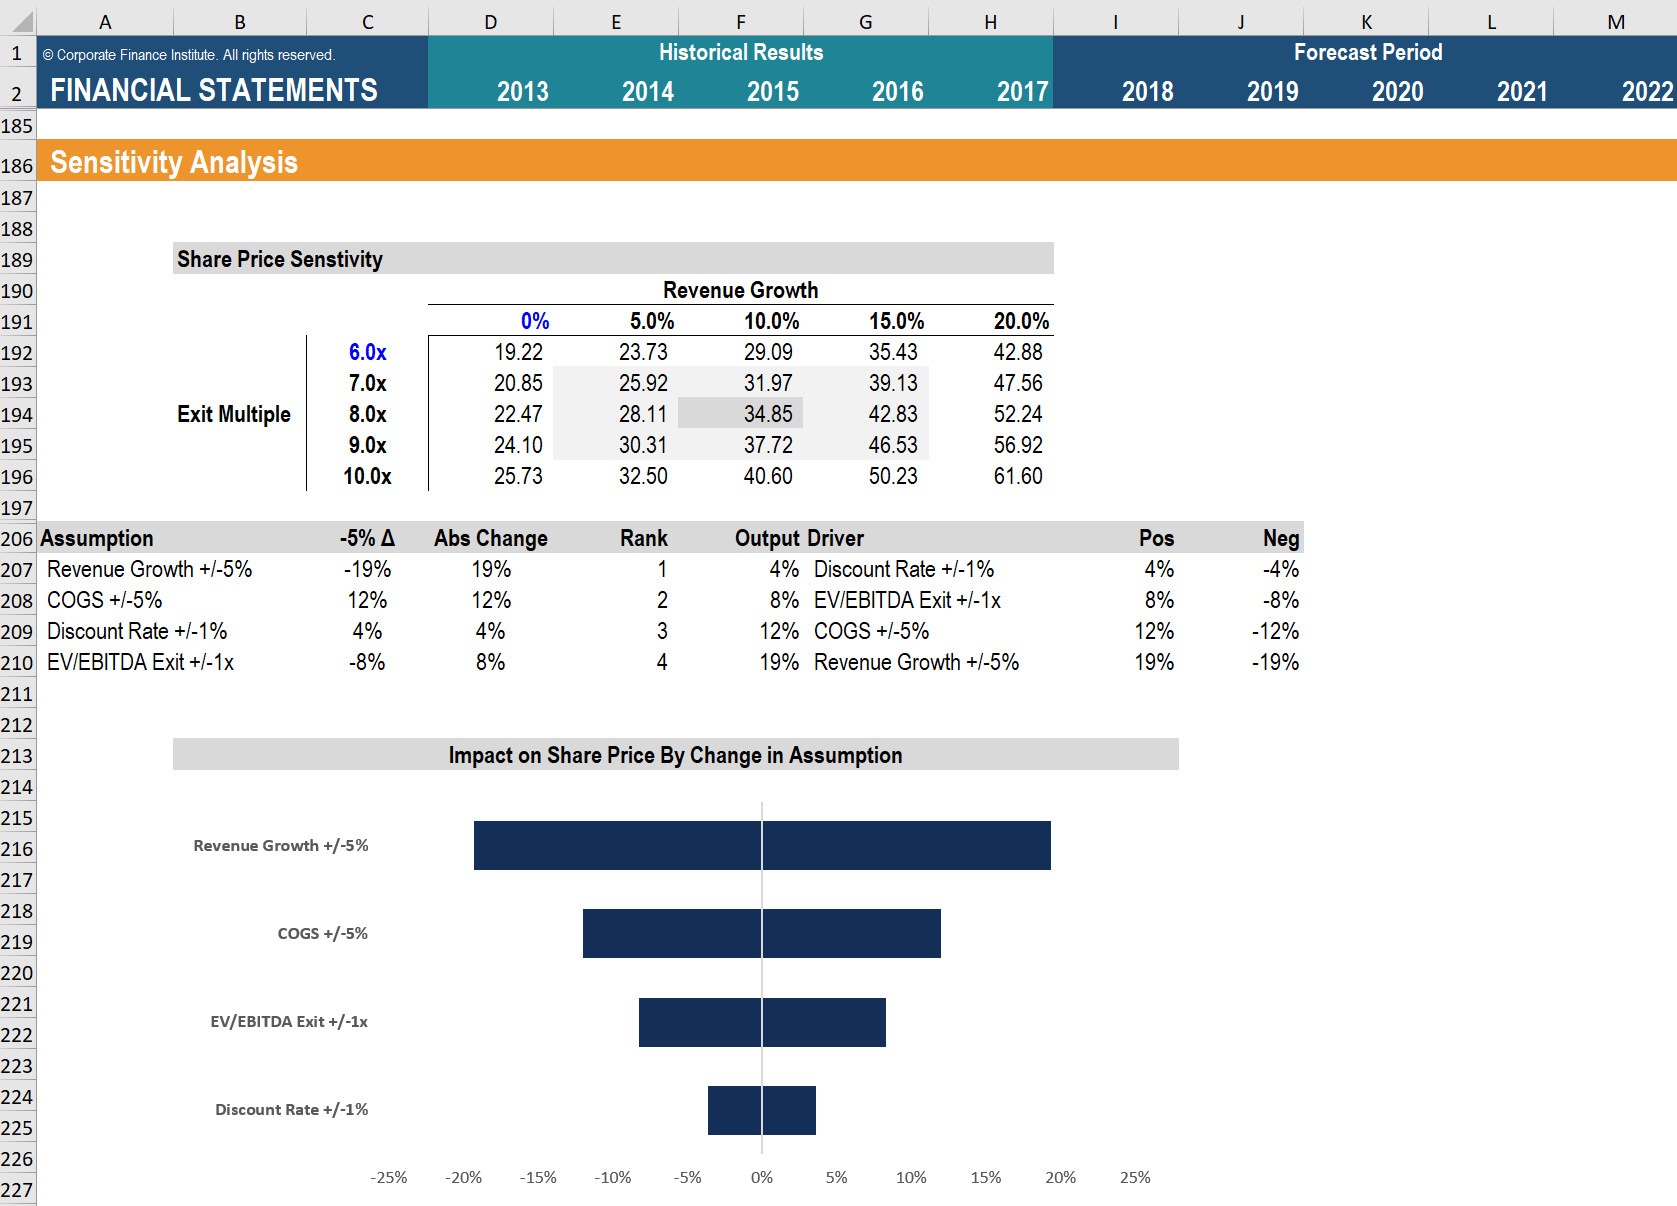
Check out CFI’s Sensitivity Analysis Course to learn more!
Variance analysis is the process of comparing actual results to a budget or forecast. It is a very important part of the internal planning and budgeting process at an operating company, particularly for professionals working in the accounting and finance departments.
The process typically involves looking at whether a variance was favorable or unfavorable and then breaking it down to determine what the root cause of it was. For example, a company had a budget of $2.5 million of revenue and had actual results of $2.6 million. This results in a $0.1 million favorable variance, which was due to higher than expected volumes (as opposed to higher prices).
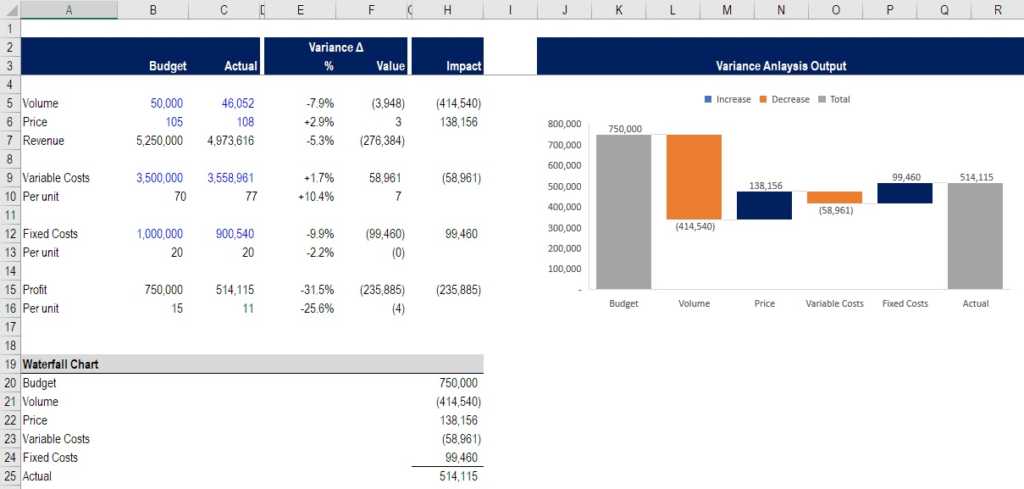
Learn more in CFI’s Budgeting and Forecasting Course.
All of the above methods are commonly performed in Excel using a wide range of formulas, functions, and keyboard shortcuts. Analysts need to be sure they are using best practices when performing their work, given the enormous value that’s at stake and the propensity of large data sets to have errors.
Best practices include:
Watch this short video to quickly understand the twelve different types of financial analysis covered in this guide.
Connect what you just learned to a clear career path with CFI’s role‑based courses and certification programs.
Thank you for reading this CFI guide to types of financial analysis. CFI is the official provider of the Financial Modeling and Valuation Analyst (FMVA) certification, designed to transform anyone into a world-class analyst. To learn more and continue advancing your career, these additional CFI resources will be helpful:


